As a business intelligence developer at KUMAVISION AG, one of the world’s largest implementation partners for Microsoft Dynamics, I am so excited about the seamless integration of Power Bi in Dynamics 365 Business Central.
You can simply use the Power BI Business Central Connector to load your business data into Power BI and create impressive reports from it. The finished reports can then be seamlessly and interactively integrated into Business Central.
In this way, the knowledge gained from reporting can be used directly in the operative business.
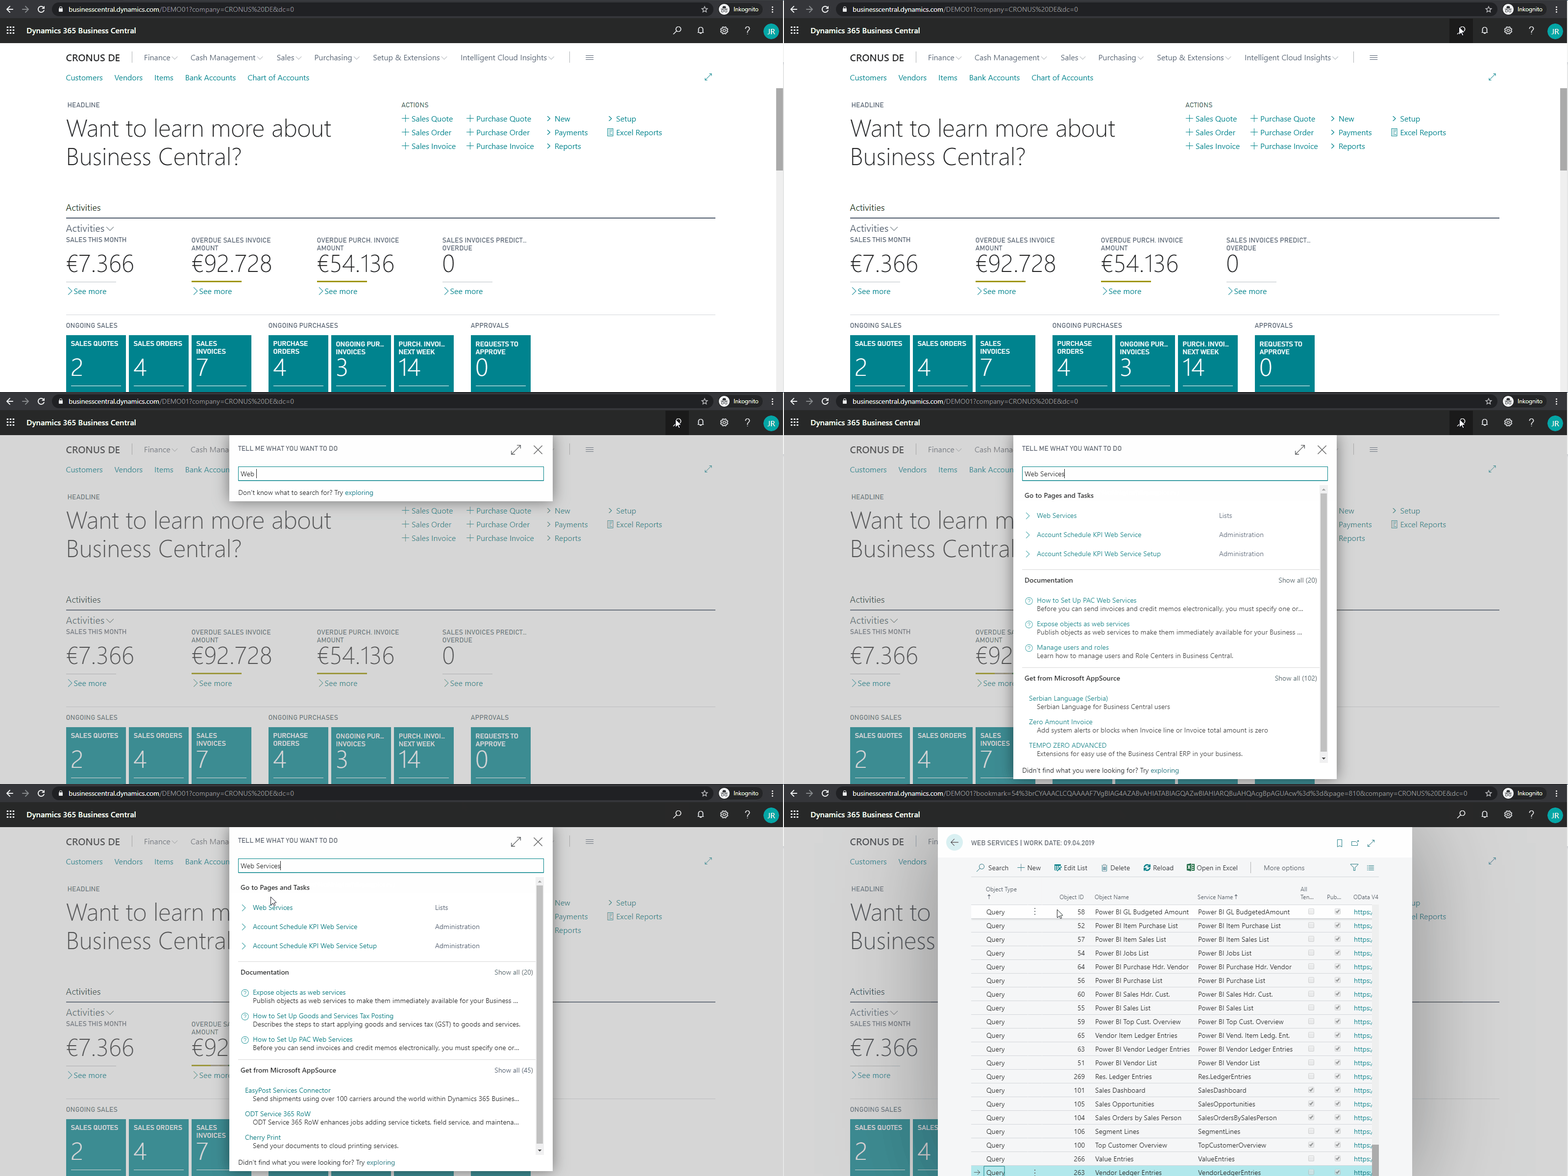
In this blog post I will show you how easy it is to implement this. To import your Business Central data into Power BI, you must have permissions to the web services used to retrieve data. An easy way to find the web services is to search for Web Services in Business Central. On the Web Services page you can publish queries or pages for loading data. Business Central already provides a set of web services here.
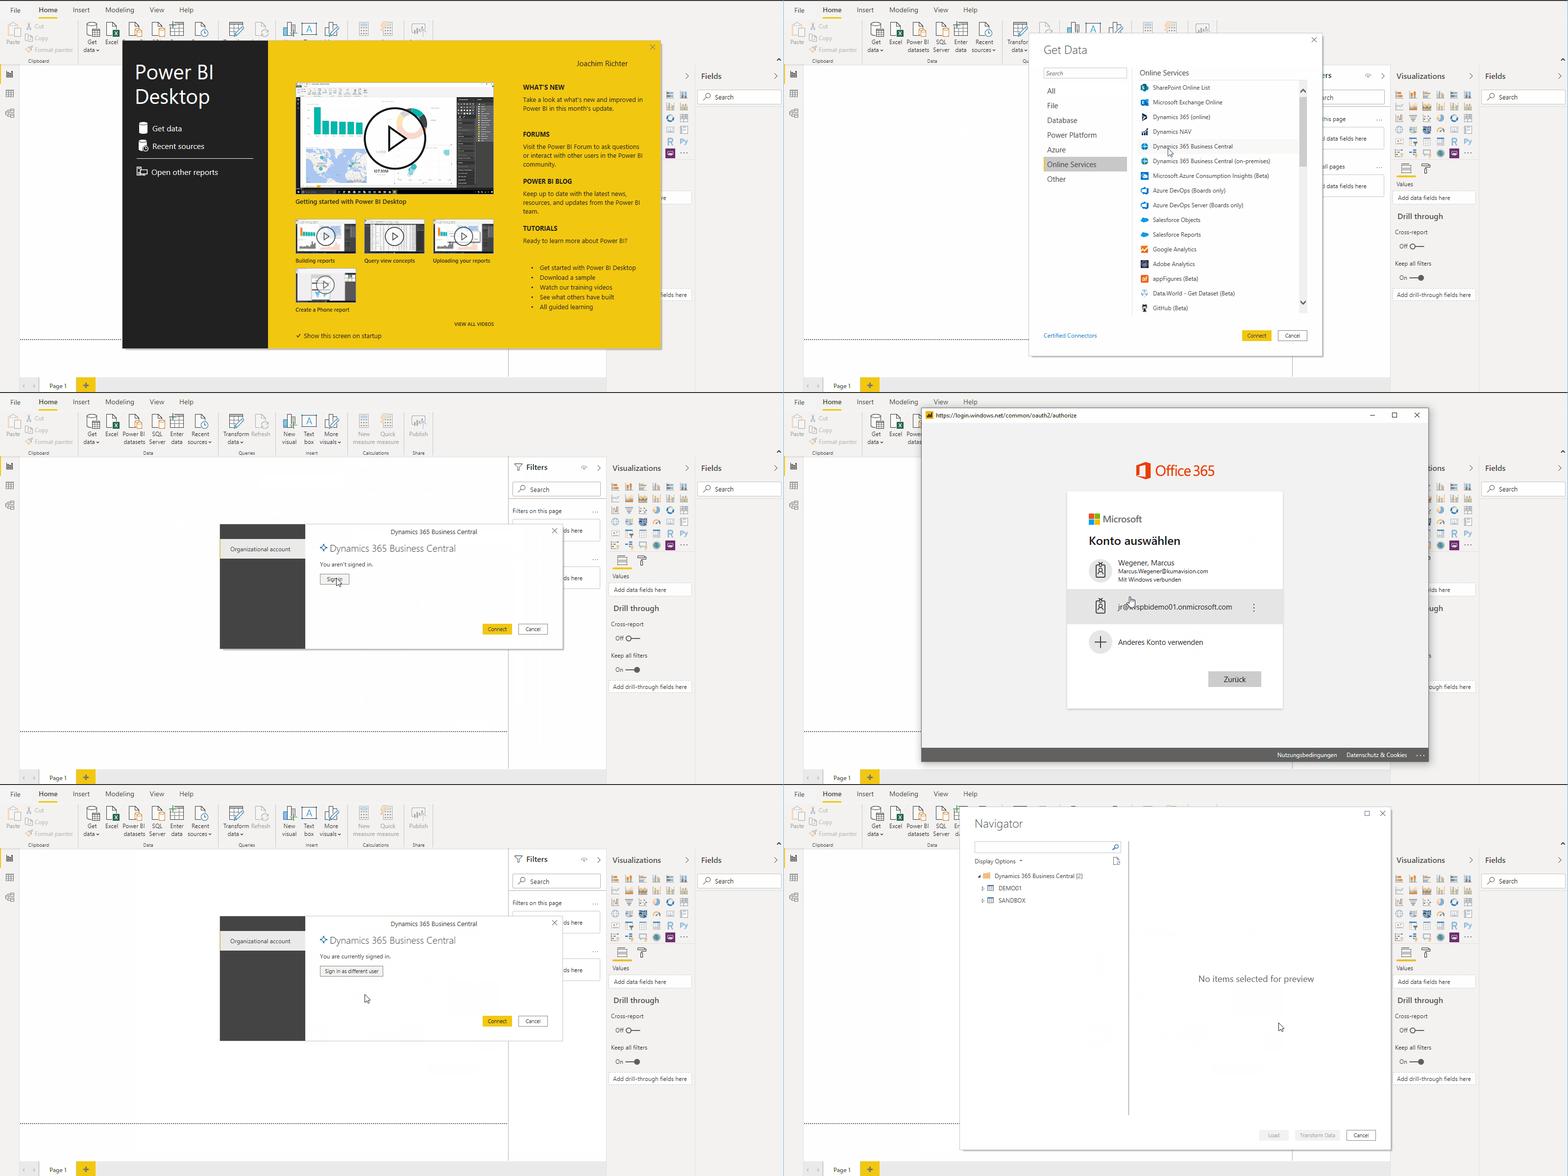
In Power BI Desktop, choose Get Data. On the Get Data page, choose Online Services, Dynamics 365 Business Central and then click on Connect. Sign in with the same account you used to sign in to Business Central.
The Power BI Navigator shows a list of Microsoft Business Central environments, companies, and data sources. These data sources represent all the web services that you have published from Business Central. In this post we choose the data source Cust_LedgerEntries and click on Transform Data.
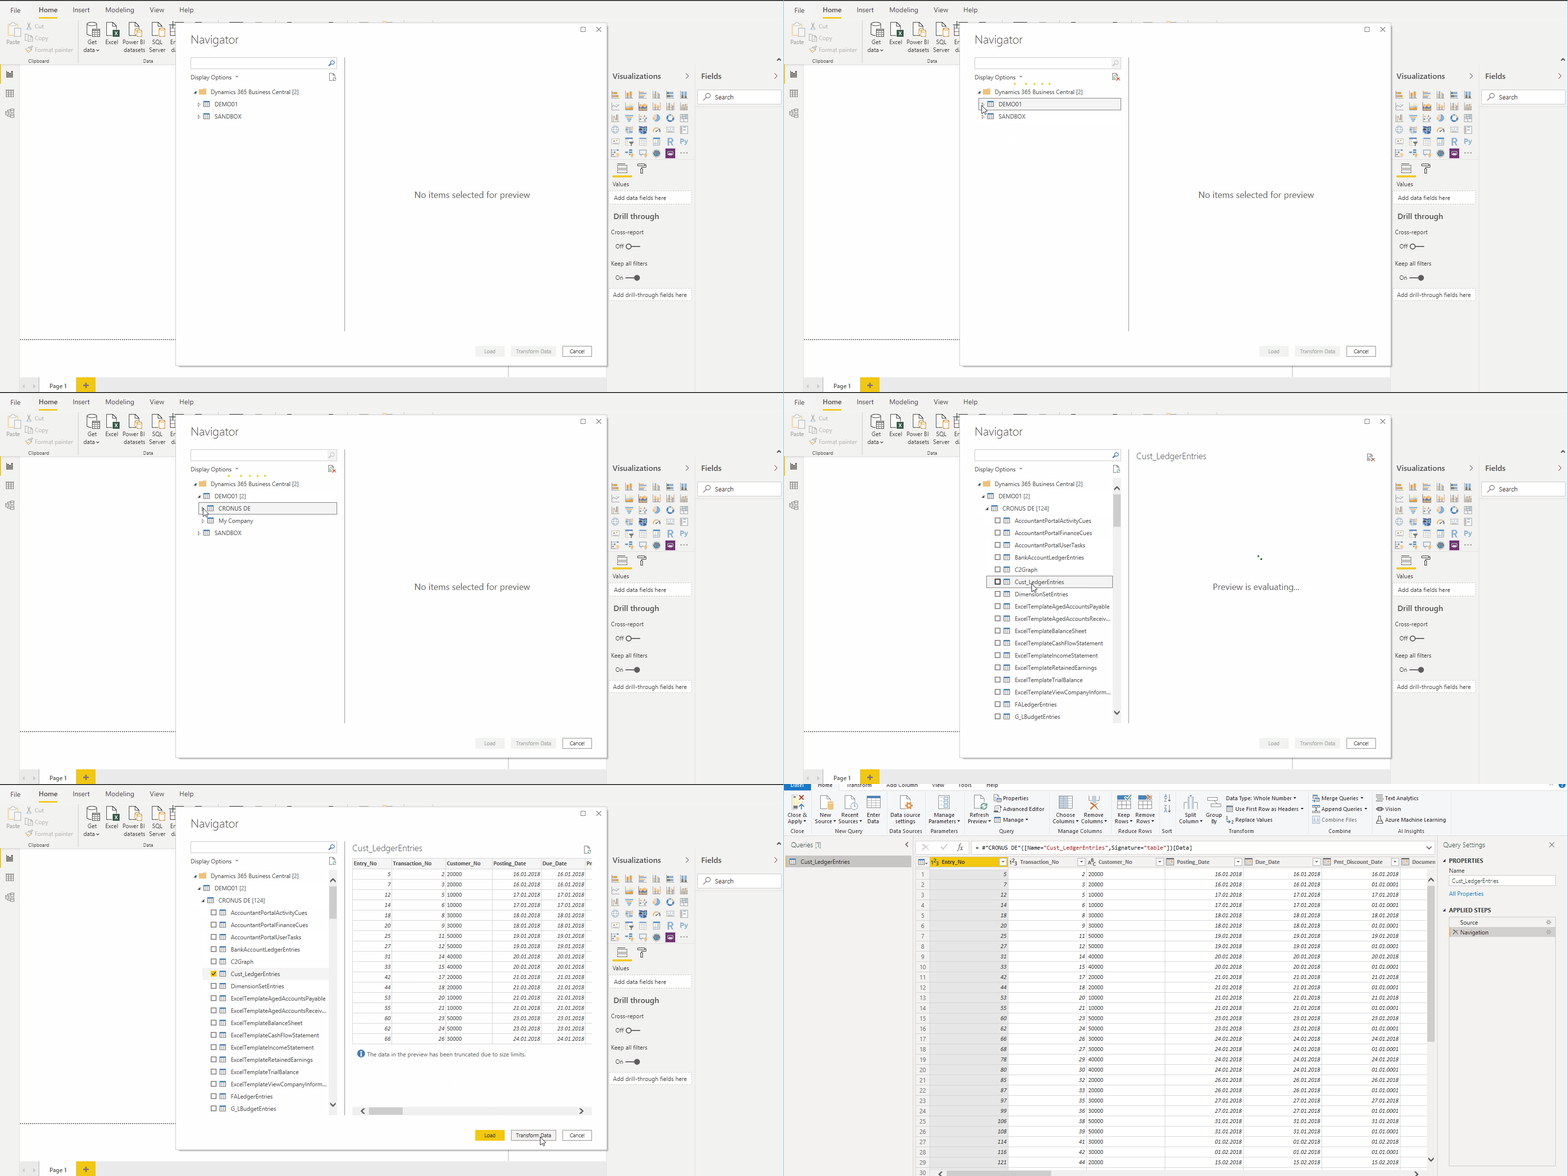
In the Power Query Editor we choose the relevant columns and load the data via Close & Apply.
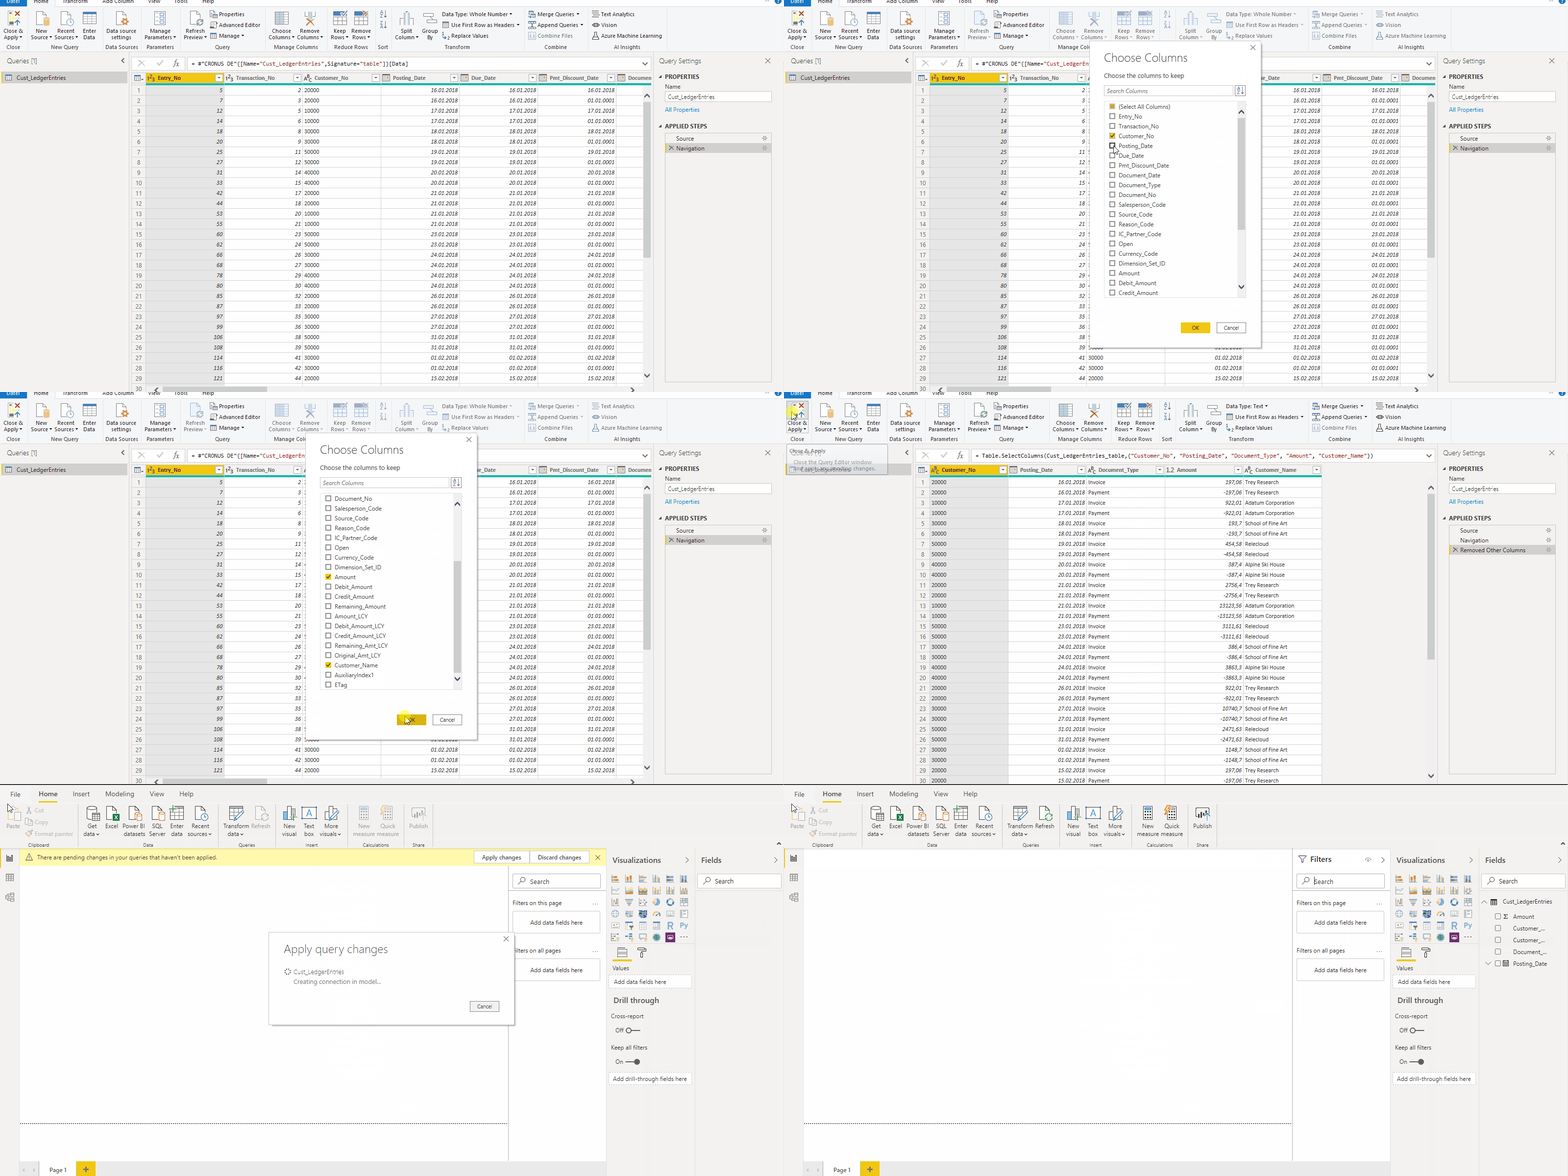
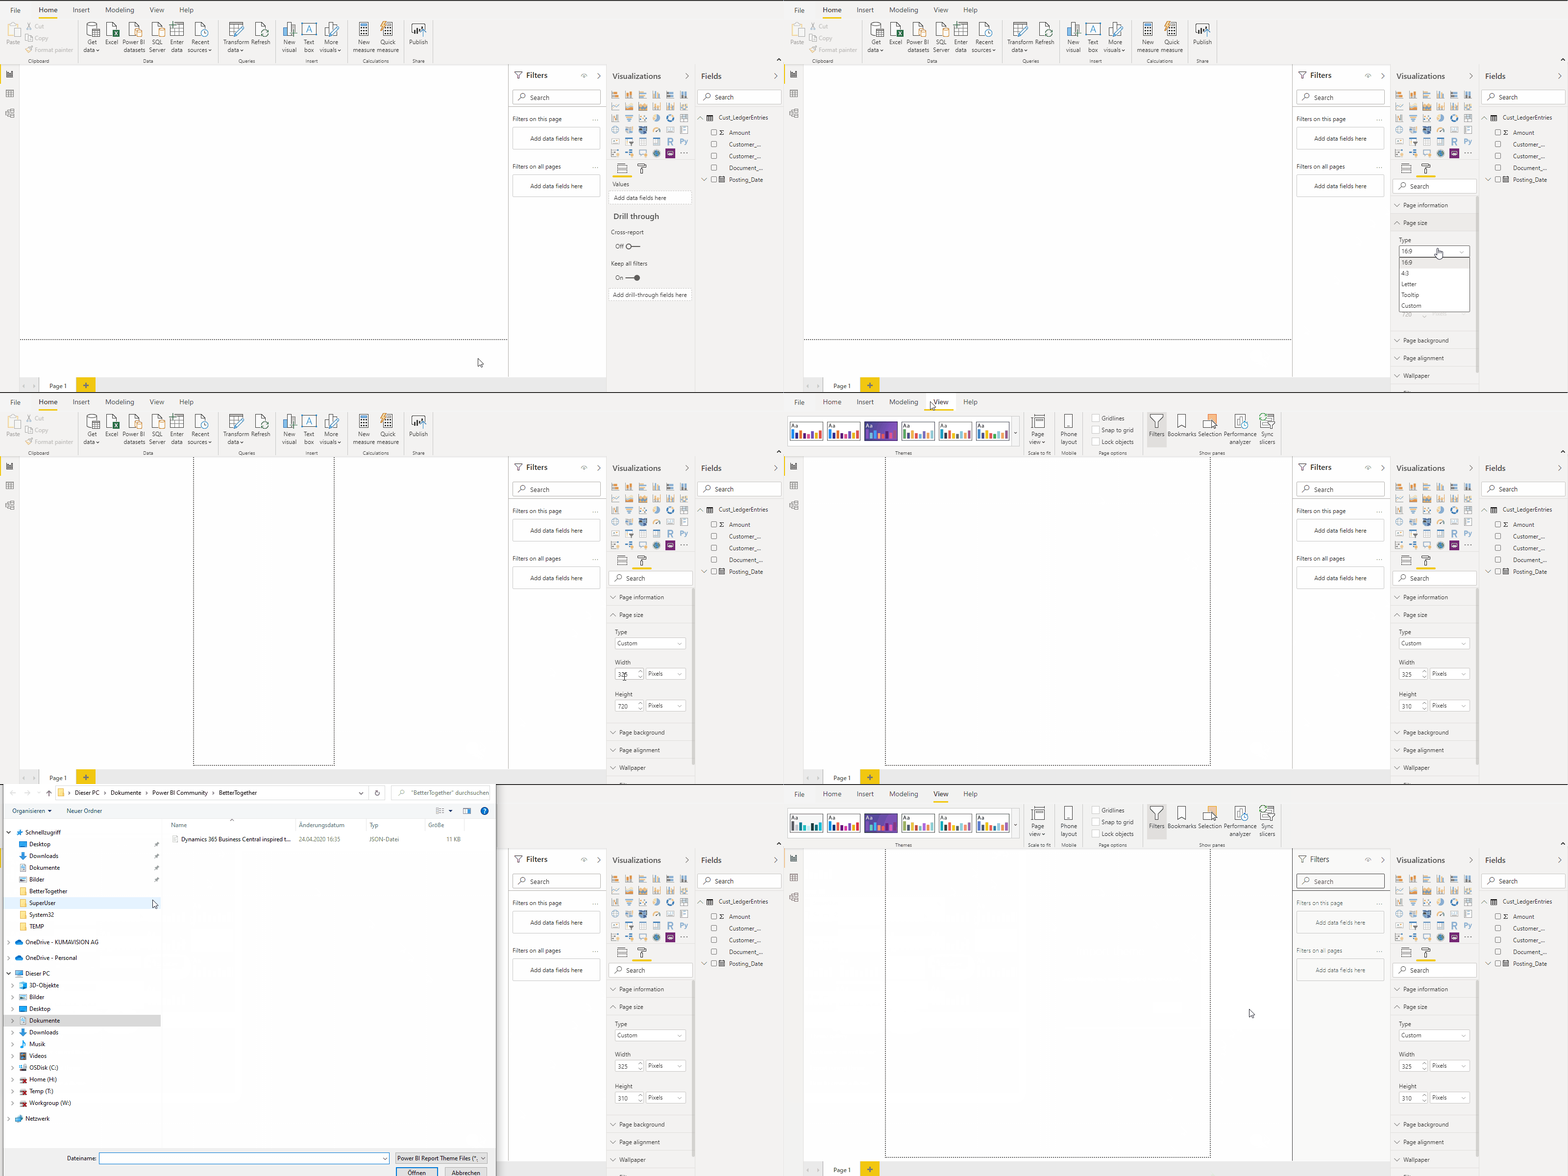
For a proper scaling of the report in the available space by the Power BI Fact Box control, the size of the report must be set to 325 pixels by 310 pixels. To define the size of the report, place focus outside the report layout area, and then choose the paint roller icon. You can change the width and height of the report by choosing Custom in the Type field. For a suitable color representation, we import my Dynamics 365 Business Central inspired theme from the Power BI Theme Gallery.
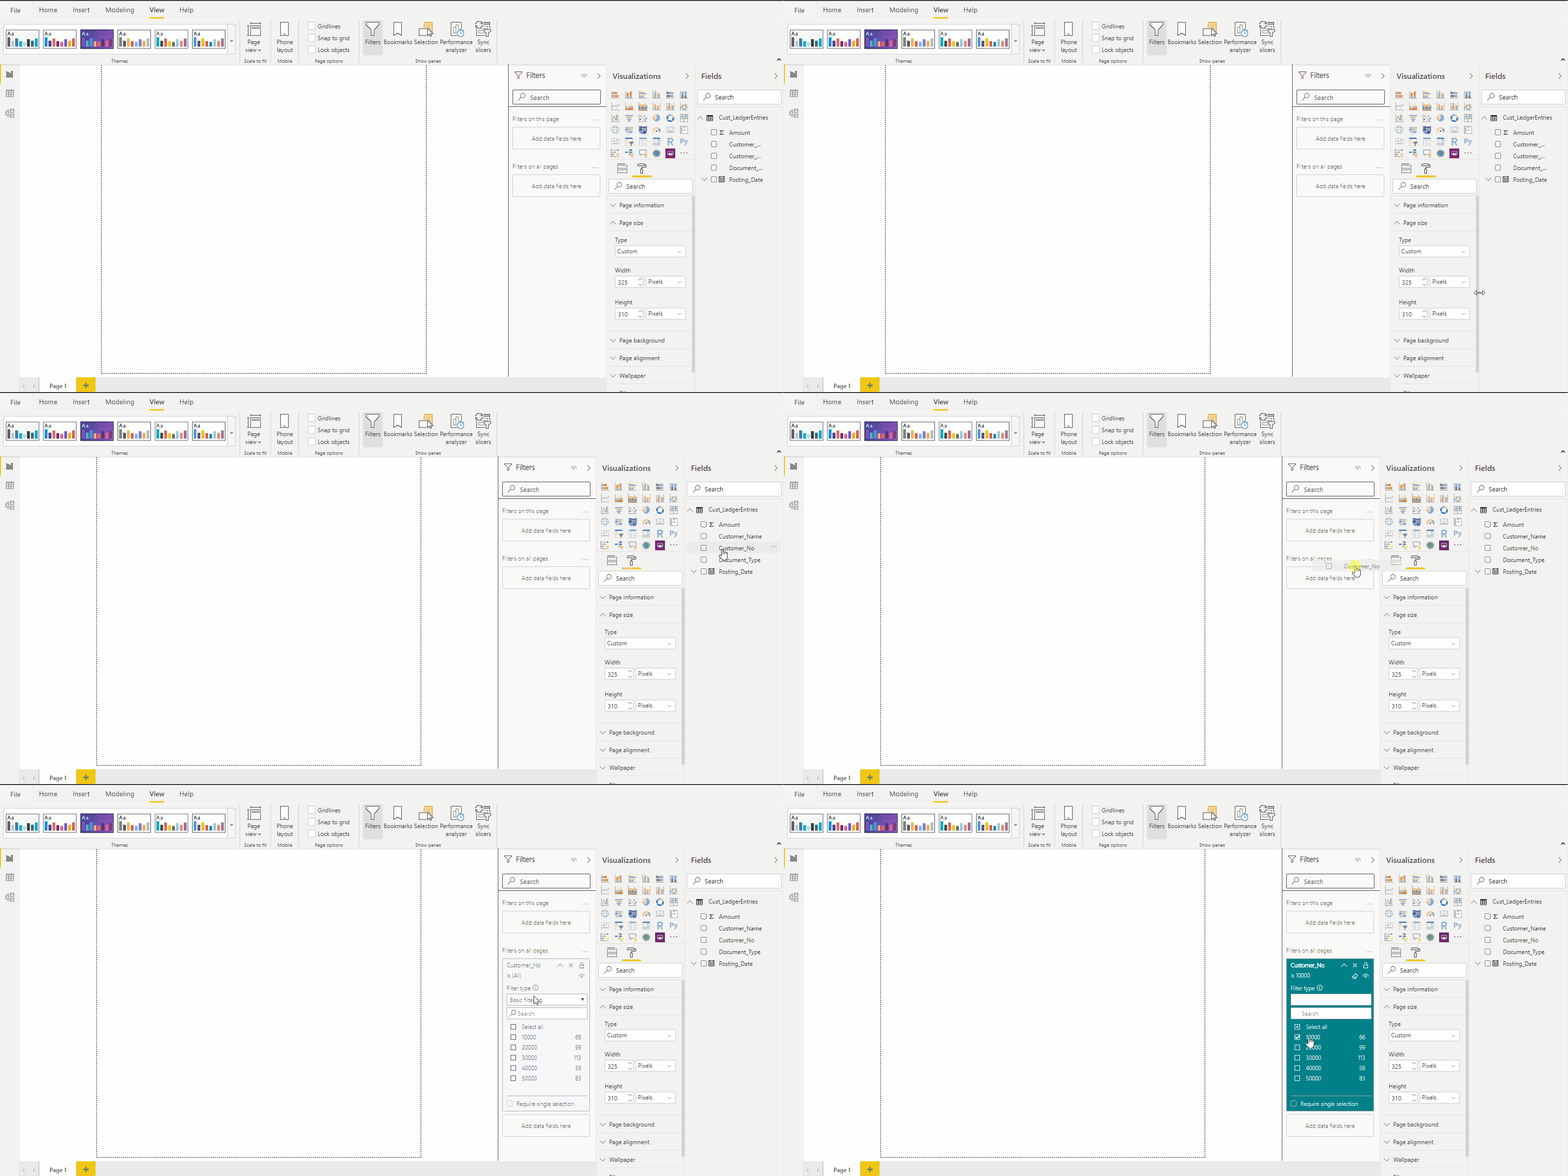
The report is required to have a basic report filter to filter correctly in the Power BI Fact Box Control. The filter that is passed to the Power BI report from each list page will be based on the primary key. In most cases, the primary key for a list is the No. field. To define a filter for the report, select the primary key from the list of available fields, and then drag and drop that field into the Report Filter section.
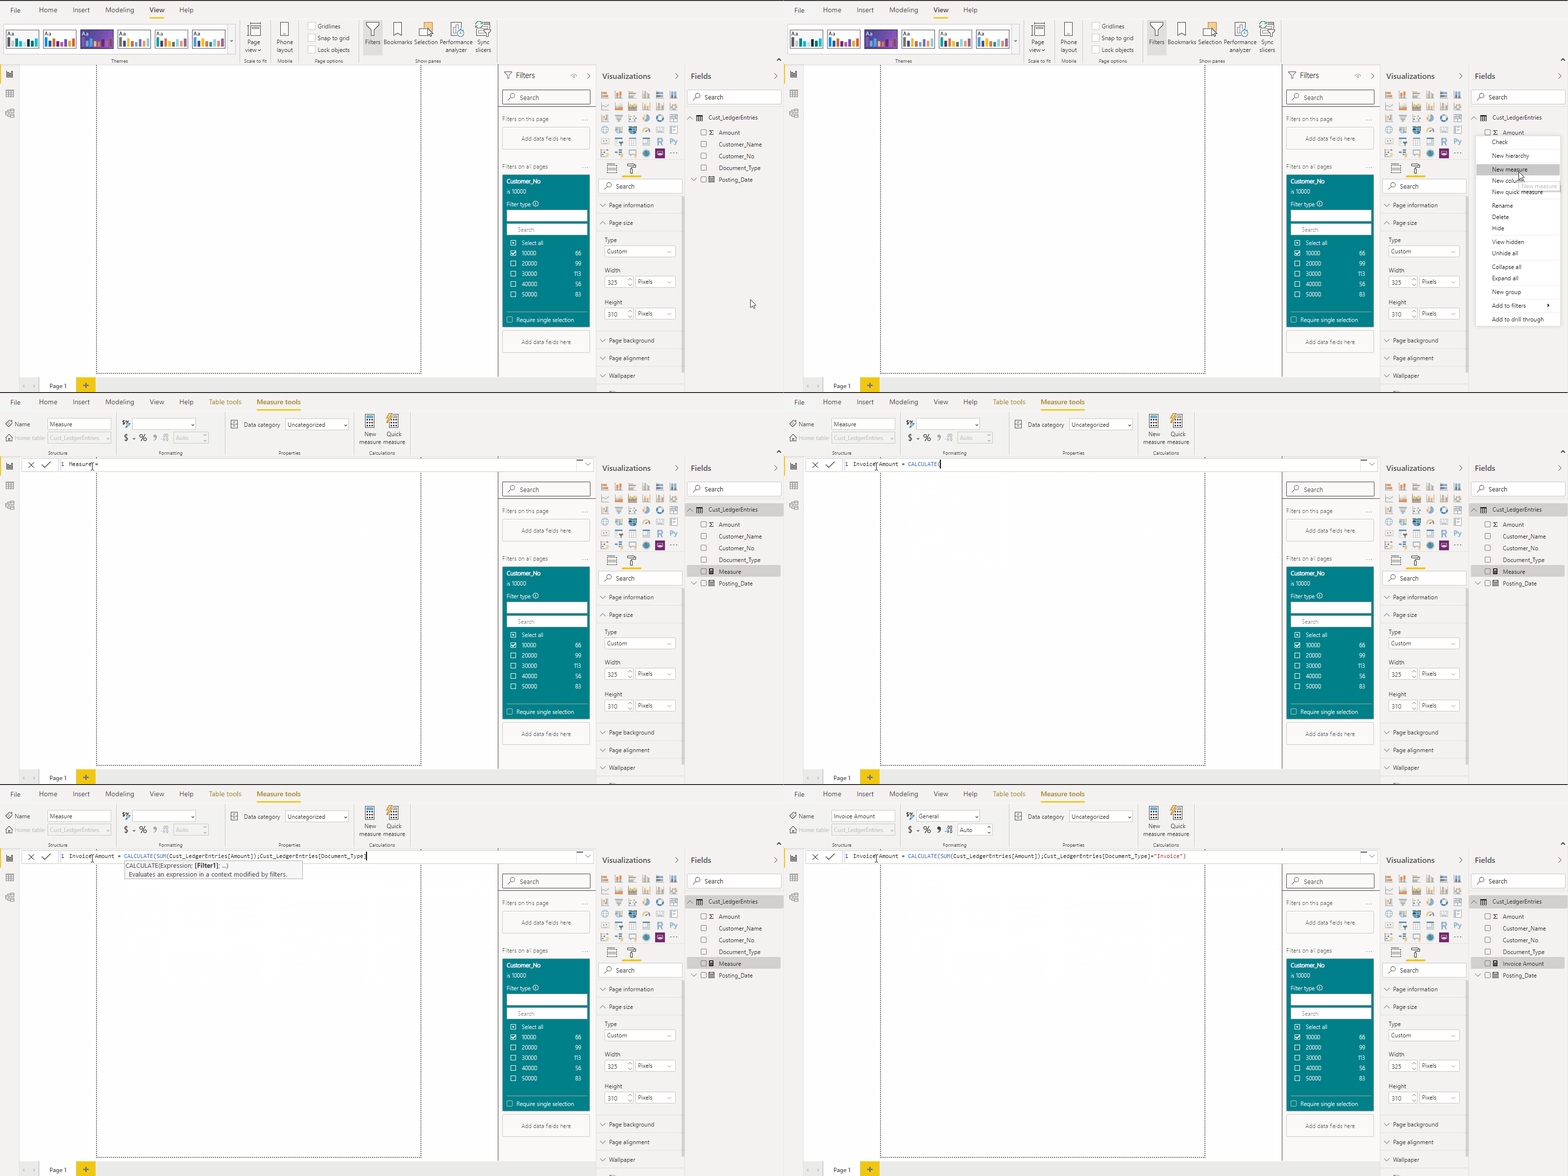
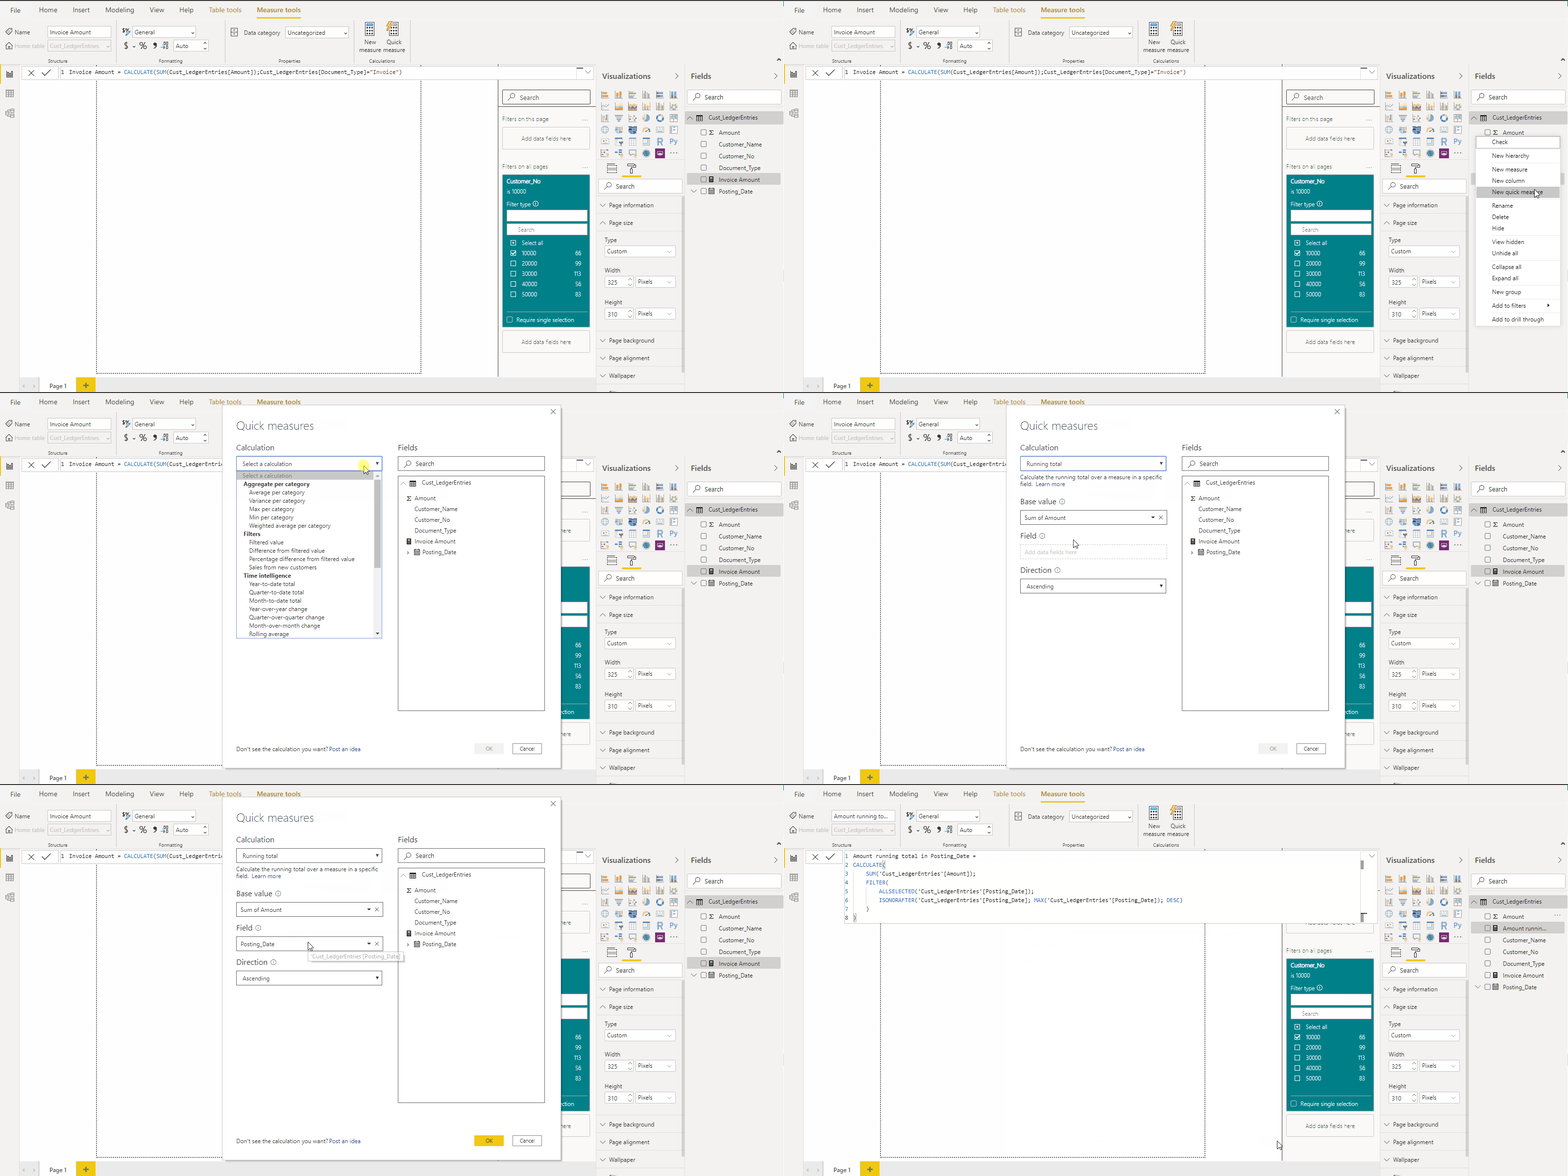
For the report we create a measure Invoice Amount to show only the invoice amounts.
We also create a running total for the amount using the Quick Measure Assistant to display the Balance Due.
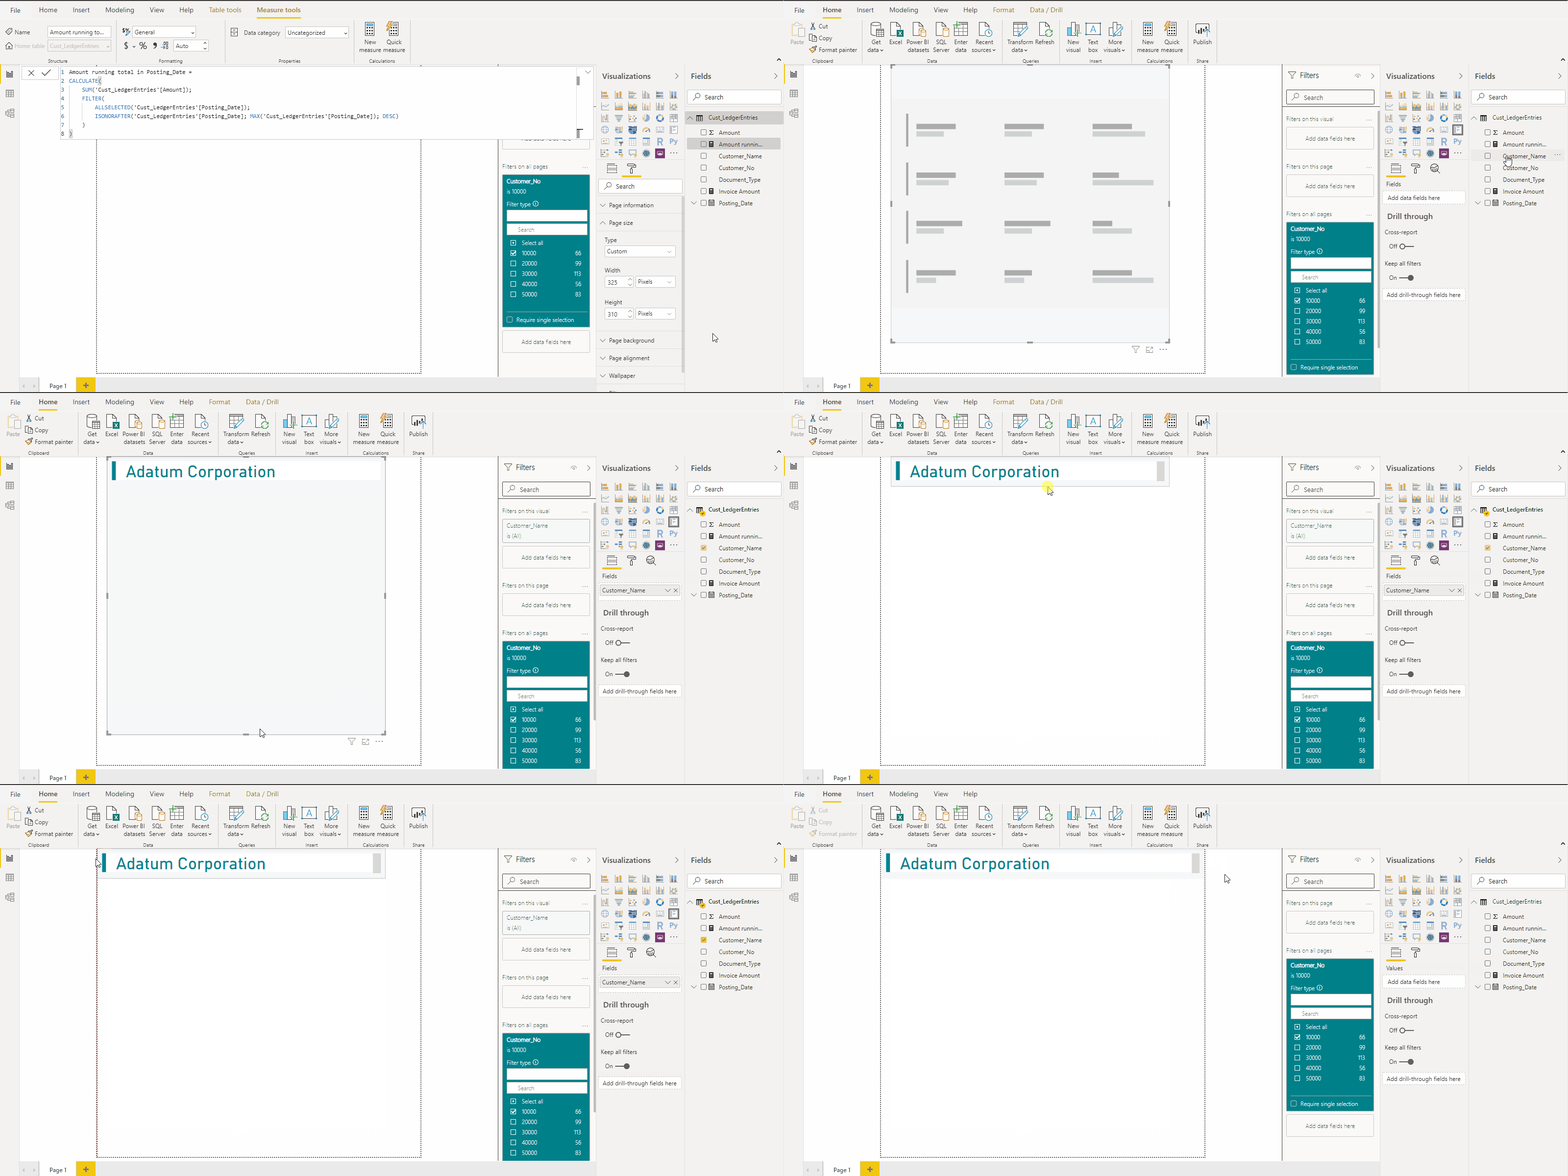
To display the active customer filter, we display the Customer_Name via a Multi-row card.
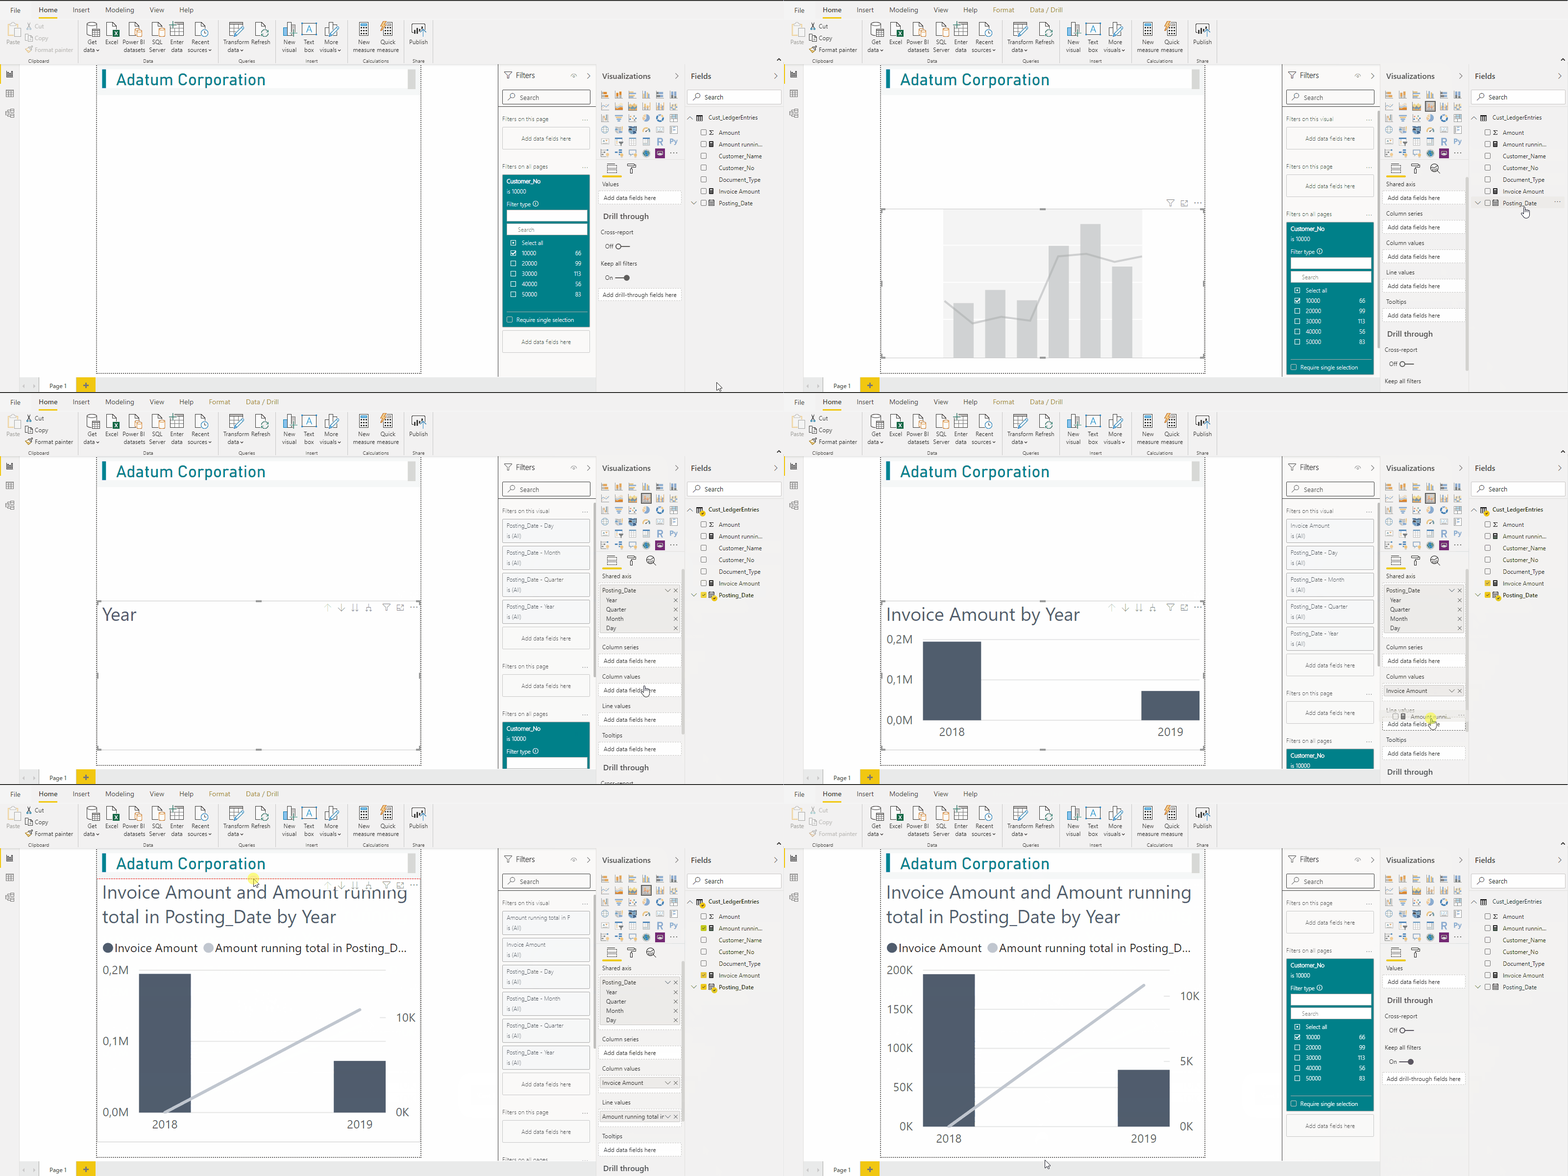
The sales invoice activity is displayed on a Line and stacked column chart.
Bring the Posting_Date to the Shared axis, the Measure Invoice Amount in the Column values field and the Measure Amount running total in Posting_Date in the Line values field.
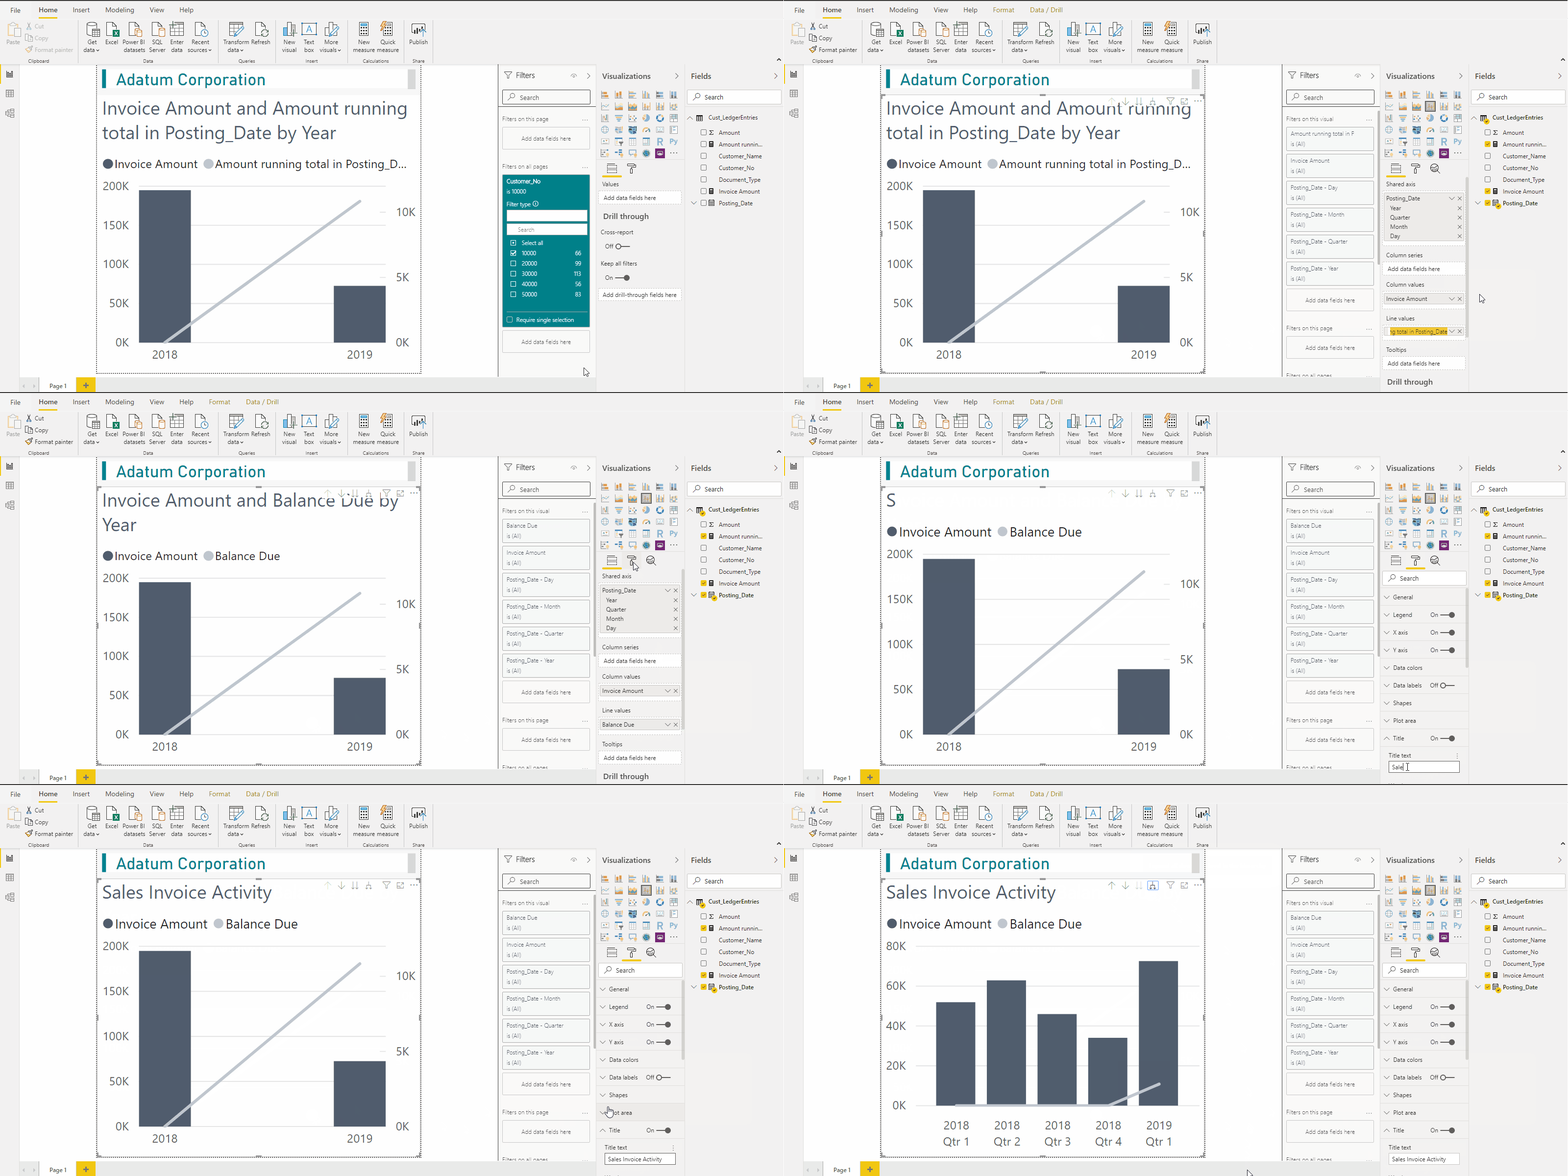
Now we adjust the names and the hierarchy level of the shared axis.
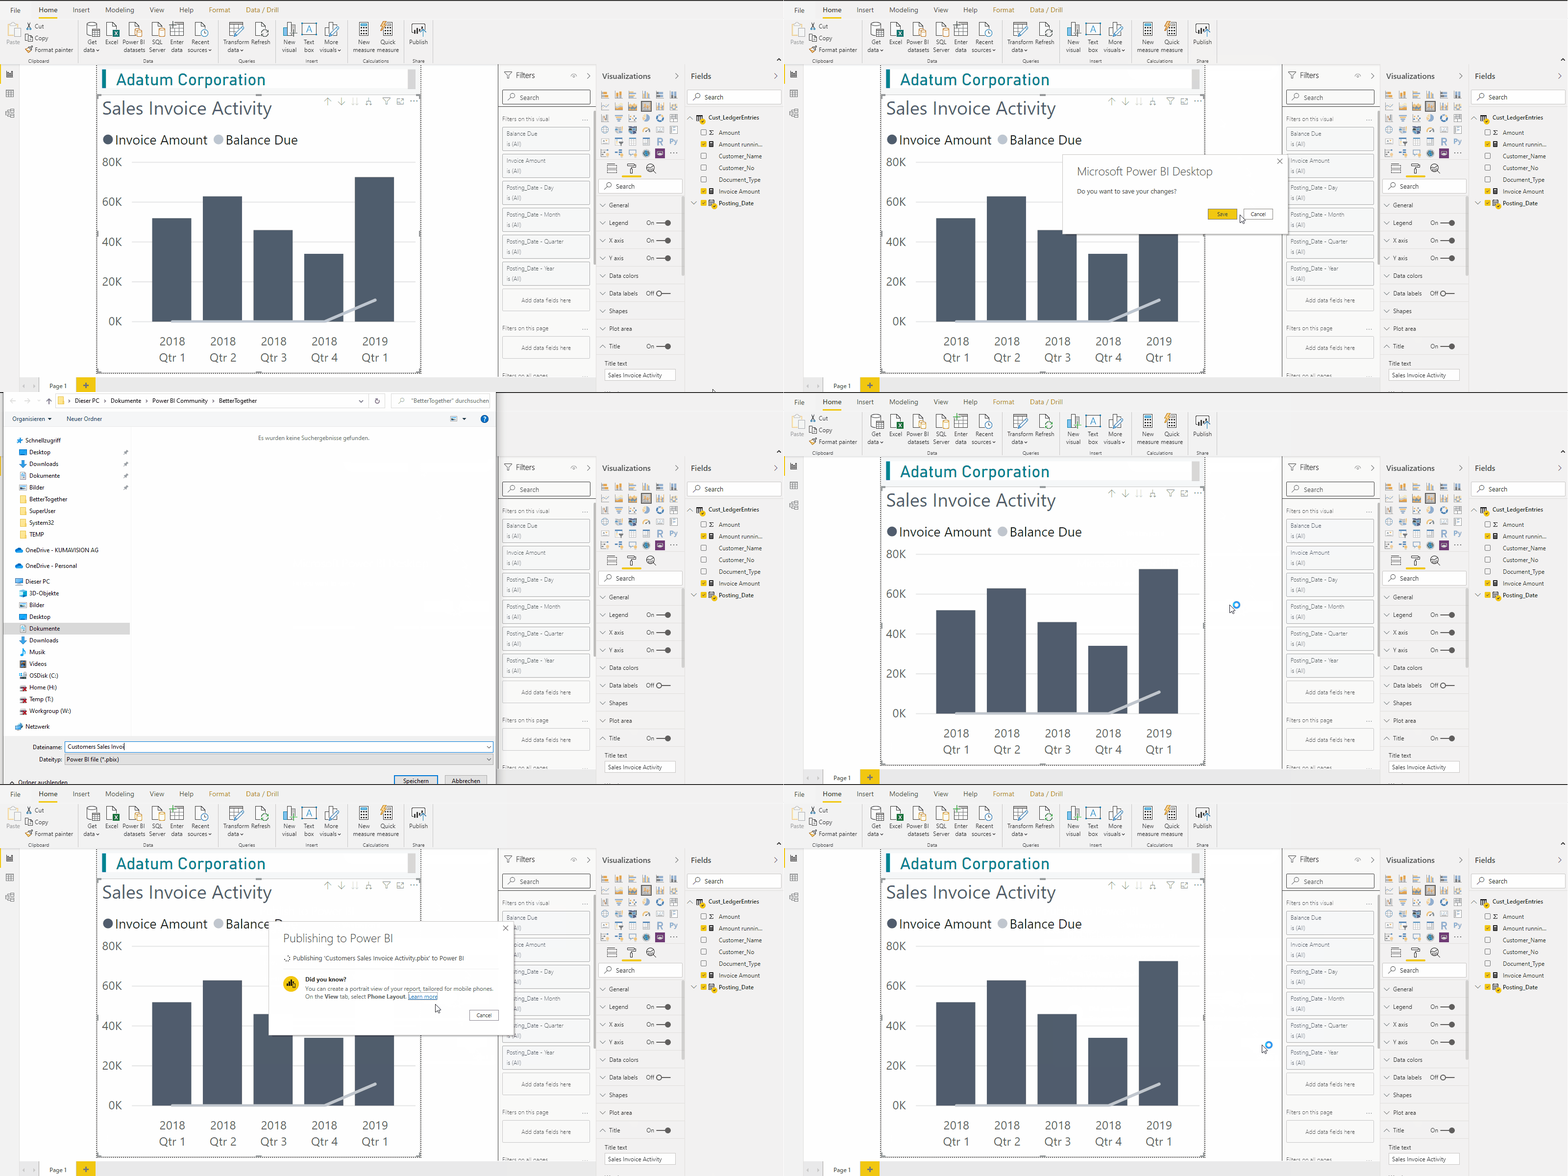
Then we publish the report in the Power BI Service.
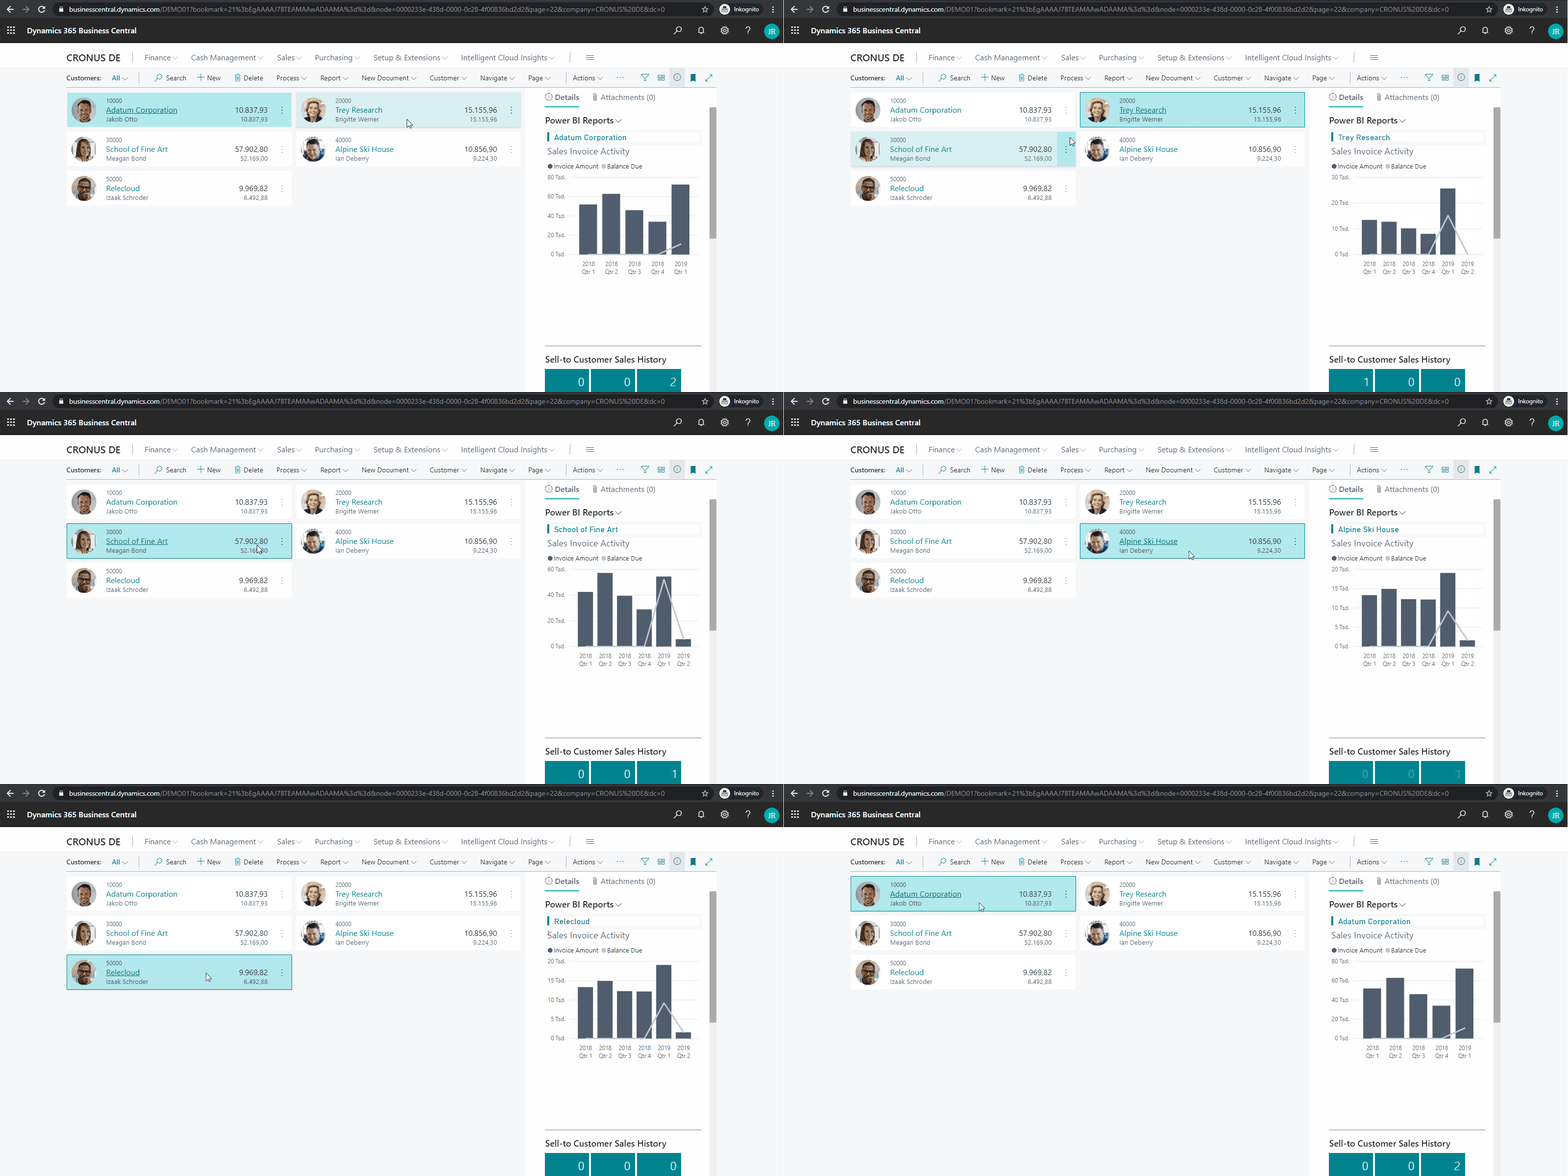
Back in Business Central, we activate the Power BI Fact Box Control on the Customer List via More Options: Actions > Display > Show / Hide Power BI Reports. With Select Report we Enable the report just published.
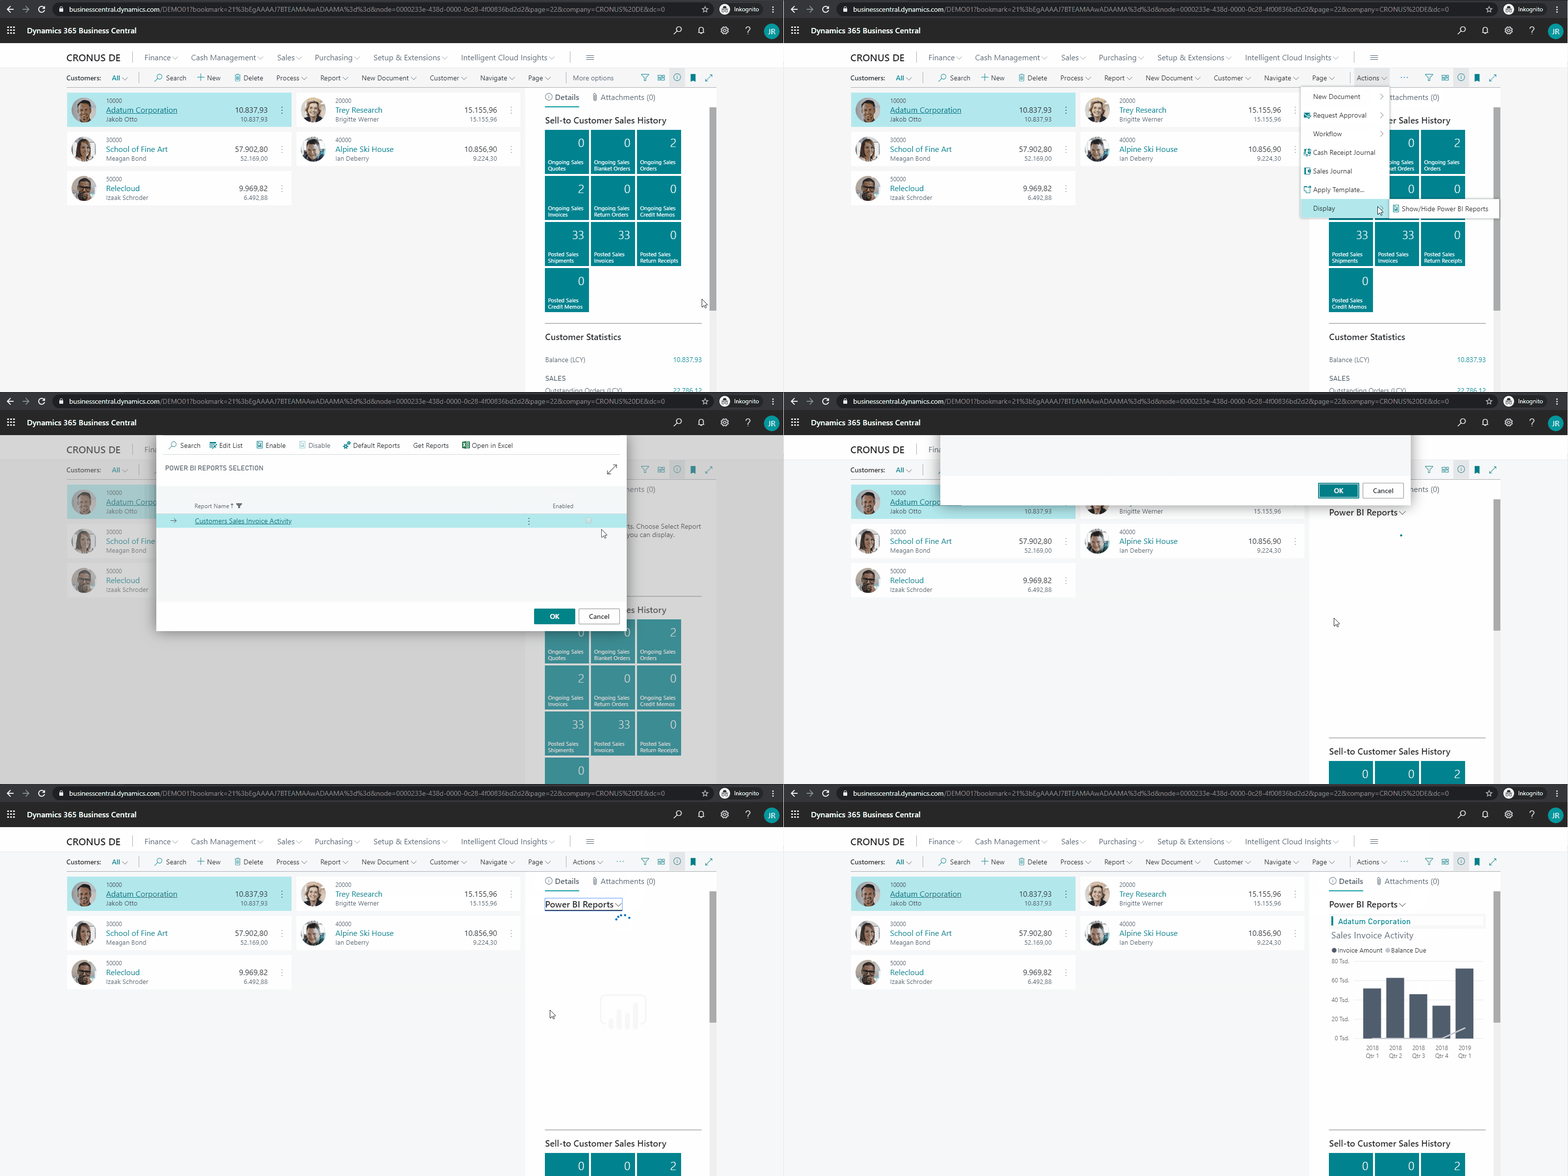
Finish! Now you can consume and filter the Power BI report directly in Business Central without leaving the application.

How cool is that? #BetterTogether

